The overview
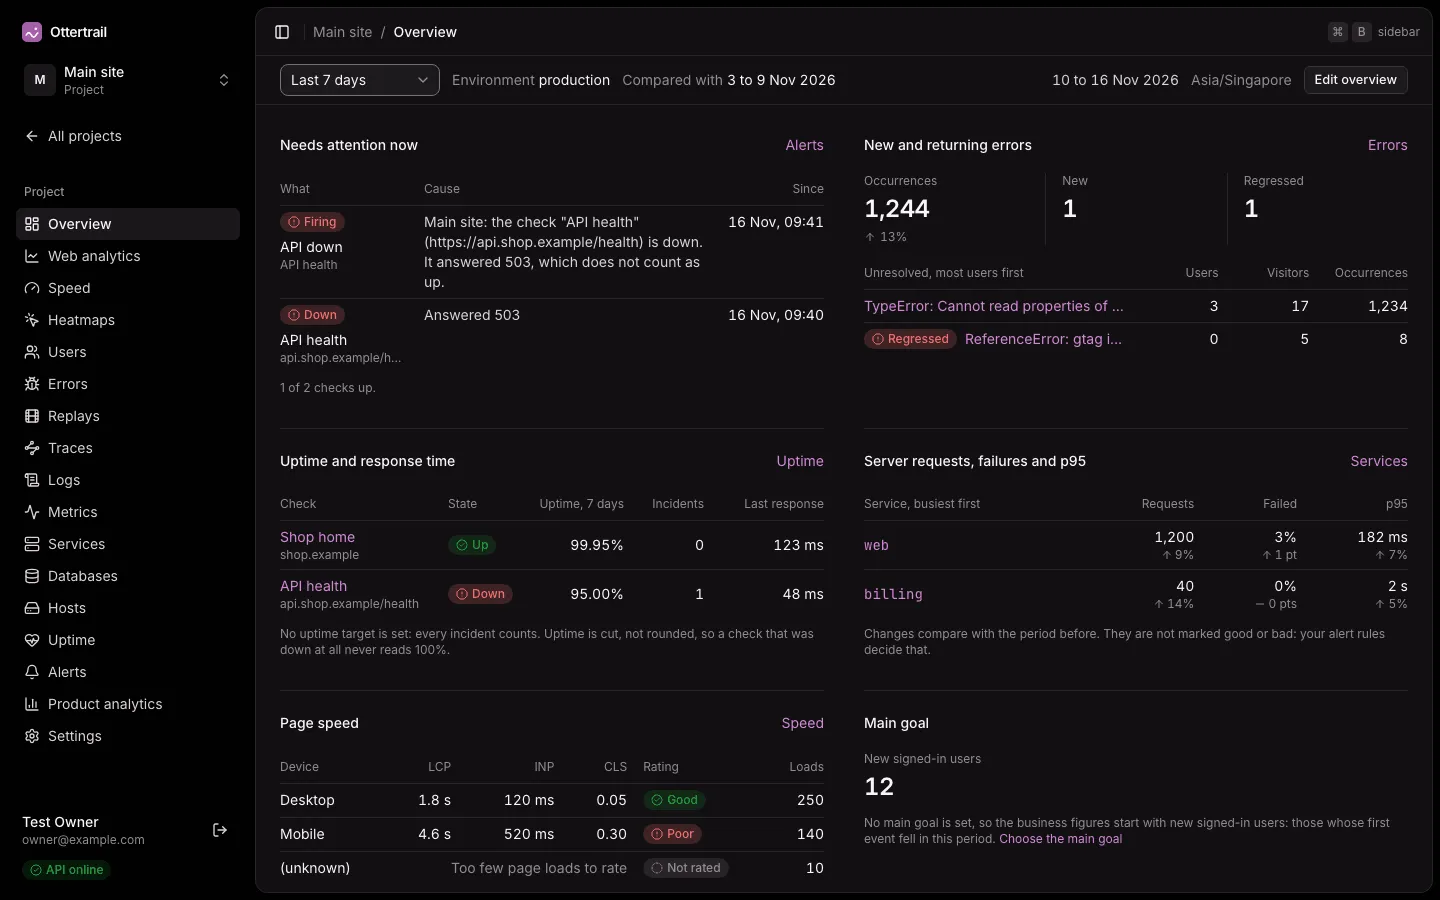
Overview is the first page in a project’s menu, and the page a project opens on. It sums up the project on one screen: whether something is broken, and whether the business is moving. Each widget links to the page that explains its figures.
The widgets
Section titled “The widgets”The widgets are in this order by default. The first four show whether the product is healthy. The next five show whether the business is moving. The last one explains the traffic.
| Widget | What it shows |
|---|---|
| Needs attention now | Alerts firing now, checks that are down, and TLS certificates that expire within 14 days or have expired, when no alert covers them yet. With nothing wrong, how many checks are up. |
| New and returning errors | Occurrences, error groups first seen in the period, regressed groups, and the unresolved groups with the most users. |
| Uptime and response time | Each check’s state, its uptime in the period, its incidents, and its last response time. |
| Server requests, failures and p95 | The five busiest services: requests, the share that failed, and the 95th percentile duration. |
| Page speed | LCP, INP, and CLS at the 75th percentile for each kind of device, with a rating. |
| Main goal | The project’s main goal: visitors, conversion, and times reached. Without a main goal, the new signed-in users. |
| Traffic | Visitors, visits, and pageviews, and visitors per day. |
| Goals and conversion | Each goal’s visitors, times reached, and conversion. |
| Signed-in users | Active and new signed-in users, and the week 1 and week 4 retention of the last six weekly cohorts. |
| Top sources and pages | The five sources and the five pages with the most visitors. |
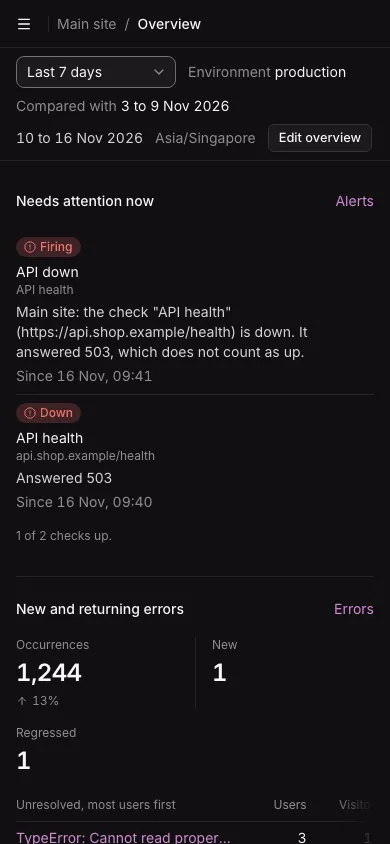
On a wide screen, the widgets sit in two columns. On a phone, they sit in one column, and a wide table scrolls inside its widget.
The period and the comparison
Section titled “The period and the comparison”The overview shows Last 7 days by default. Today and Last 30 days are the other choices. Each figure is compared with the period right before. A period that is still running is compared up to the same moment of the period before. The filter bar shows both ranges and the instance’s timezone.
- A change shows only when the larger of the two counts behind it reaches a minimum: 10 for errors, and 20 for page loads, requests, visitors, and users.
- A figure whose period before had nothing reads “New”.
- A change is an arrow and a size. Colour marks only what a rule or a threshold calls bad: a firing alert, a check that is down, a poor Web Vitals rating, or a regressed error. Server changes are not judged; your alert rules do that.
- Uptime shows incidents only. There is no uptime target.
- Page speed rates a device only from 20 page loads. Below that, it says “Too few page loads to rate”. A device’s rating is the worst rating of its three metrics.
- Visitors count a person once for each day they visited, as everywhere in web analytics.
- Sources and pages are not compared with the period before.
The bounce rate and the visit duration are on the web analytics report, not on the overview.
The overview shows production, the default environment. It has no environment picker yet.
The main goal
Section titled “The main goal”The Main goal widget starts the business figures. The owner or an admin chooses the main goal in the project’s Settings, on the General tab, from the project’s goals. The widget’s Choose the main goal link opens that tab. Goals are added on the web analytics report. See Goals.
Without a main goal, the widget shows the new signed-in users: those whose first event fell in the period. Deleting the goal that is the main goal clears the setting.
Who sees what
Section titled “Who sees what”Each widget belongs to an area: uptime and alerts, errors, monitoring, web analytics, or product analytics. A member sees only the widgets of the areas they were given. The others are not shown at all. A member with none of these areas sees “Nothing on your overview”, with links to the pages they can open, and the project opens on their first page instead. See Members and roles.
Arrange your overview
Section titled “Arrange your overview”- Select Edit overview.
- Use Move up, Move down, and Hide or Show on each widget. Each change applies and is saved at once.
- Select Done.
Reset to default puts back the default order. The dashboard does not load a hidden widget’s data.
Your layout belongs to you and this project. It follows you to any browser. Other people’s overviews do not change.
Each widget loads on its own. If one fails, it shows the error with Retry, and the other widgets stay. A widget with nothing to show says why: nothing set up yet, with a link to the page that explains how, or nothing in the period.
Not available yet: settings for each widget (which goal, services, or checks), a default layout for a whole project, an overview across projects, and an environment picker.