Databases
The Databases page shows the database calls inside your traces, grouped by database and by query shape: how many calls, how much time they took in all, how slow they were, and how many failed. It answers “which query got slow”. The data comes from the traces your servers send (Send telemetry). Nothing more needs to be sent.
Open Databases in the project’s menu, after Services. You need view access to monitoring (Members and roles). The Databases pages are reports, with the period and the environment in the filter bar at the top (Reports).
Which spans are database calls
Section titled “Which spans are database calls”A database call is a span of kind CLIENT with a database system attribute. Most OpenTelemetry instrumentations of database clients record one such span per query. OpenTelemetry renamed most of these attributes, and instrumentations still send both, so Ottertrail reads the first name a span has:
| What | Current name | Older names also read |
|---|---|---|
| System | db.system.name |
db.system |
| Database | db.namespace |
db.name, db.redis.database_index, db.elasticsearch.cluster.name |
| Operation | db.operation.name |
db.operation |
| Collection | db.collection.name |
db.sql.table, db.mongodb.collection, db.cassandra.table, db.cosmosdb.container |
| Summary | db.query.summary |
none |
| Query text | db.query.text |
db.statement |
A span without a system is not a database call, and neither is a span of another kind. A call failed when its span’s status is Error.
Query shapes
Section titled “Query shapes”Calls are grouped by system, database, and query shape. The shape is the first of these that a call has:
- its
db.query.summary, such asSELECT orders; - its query text, normalized (below);
- its operation and collection, such as
find products; - its span’s name.
The normalized text replaces string literals, numbers, and IN lists with ?, removes comments, collapses white space, and keeps one row of a multi-row VALUES:
| Query text | Shape |
|---|---|
SELECT * FROM orders WHERE id = 42 AND name = 'O''Brien' |
SELECT * FROM orders WHERE id = ? AND name = ? |
select * from t where id in (1, 2, 3) |
select * from t where id in (?) |
SELECT * FROM t WHERE id IN (@p0, @p1, @p2) |
SELECT * FROM t WHERE id IN (?) |
INSERT INTO t (a, b) VALUES (1, 'x'), (2, 'y') |
INSERT INTO t (a, b) VALUES (?, ?) |
/*traceparent='00-…'*/ SELECT a FROM t -- by id |
SELECT a FROM t |
SELECT col_1 FROM t3 WHERE a = $1 |
SELECT col_1 FROM t3 WHERE a = $? |
Known limits of the shapes:
- Case is kept:
selectandSELECTare two shapes. - Double quotes are left alone, since they hold names in standard SQL. A database that also takes double-quoted strings keeps them in the shape.
- A backslash before a quote is read as escaping it, as in MySQL. In standard SQL strings, such as PostgreSQL’s by default, a string that ends in a backslash makes the rest of the query’s shape unlike the same query with another value.
- A shape shows up to 1,000 characters. Two long queries that differ only after that are still two shapes.
The Databases page
Section titled “The Databases page”At the top, a chart shows every database call over the period. Calls per second, beside its title, draws the calls per second; Time spent draws the time the calls took in each step, added up. Hover the chart, or use the arrow keys on it, to read a moment, and Show the numbers opens the data as a table. The chart loads apart from the tables: if it fails, it says so with Retry, and the tables still show.
A line under the chart says what the page reads. Then each database has a section, the one with the most time spent first, named by its database and system, such as “shop on postgresql”.
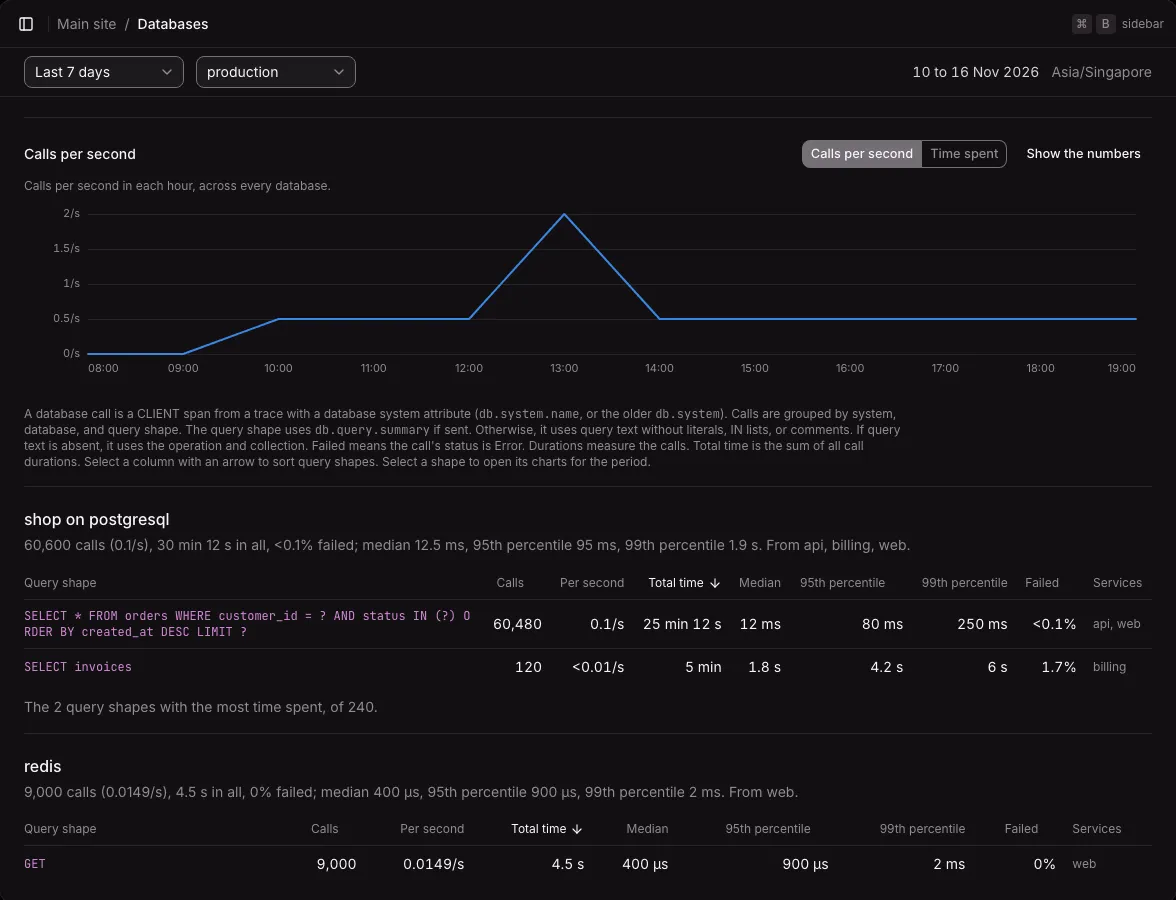
- The database’s line gives its calls, calls per second, total time, failed share, median, 95th, and 99th percentile, and the services that make the calls.
- Its query shapes follow in a table, with the same numbers for each shape. The shape is a link to its page.
- Calls, Total time, 95th percentile, and Failed are buttons that sort the shapes, largest first. The column sorted by has an arrow. Total time is the default: the shapes that cost the most come first.
A query shape’s page
Section titled “A query shape’s page”Select a shape to open its page.
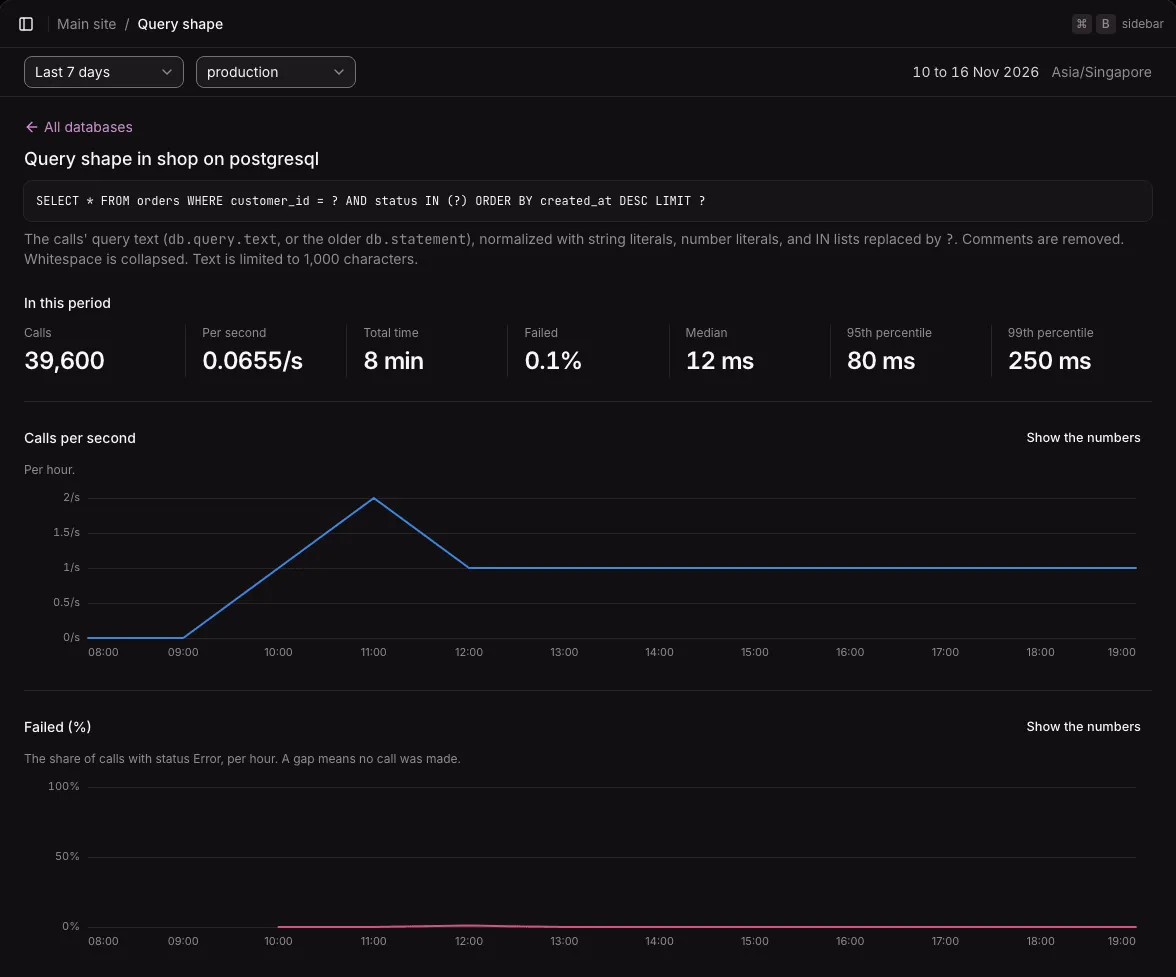
- the database, the shape in full, and what it was made from (the summary sent, the query text normalized, or the operation and collection);
- In this period: calls, per second, total time, failed, median, 95th, and 99th percentile;
- charts of Calls per second, Failed (%) (a gap means no call was made), and Duration (the median, 95th, and 99th percentile, in ms or s), each with “Show the numbers”;
- the 20 slowest calls of the period, each with its start, duration, service, an Error badge or “No error”, and Open its trace, which opens the trace’s page on the call’s span;
- the services that make the calls, each a link to its page on the Services page;
- the routes of the requests behind the latest 1,000 calls, each a link to its route’s page. A call outside a request, such as a background job’s, shows as “No request found”.
All databases goes back to the list.
When nothing shows
Section titled “When nothing shows”- No traces yet: while the project has sent no spans, the page shows the OpenTelemetry settings to copy, as the Traces page does.
- No database calls in this period: spans arrived, but no database call. Turn on the OpenTelemetry instrumentation for your app’s database client: the SDK’s automatic instrumentations, or the package for that client.
- The page could not load: the page says so and offers Retry. It does not retry by itself.
Limits
Section titled “Limits”- The page lists up to 50 databases, those with the most time spent, and up to 200 shapes of each in the chosen order. Past them, a line says how many there are.
- Two servers with the same database name count as one database.
- When a sender retries a batch, its calls can count two times for up to about an hour after the day’s last spans arrive.
- Not available yet: alert rules on a query shape, and a call’s query with its literal values kept. A slow call’s span still holds the text the instrumentation sent: open its trace.