Traces
A trace is one request through the services it touched, as a tree of spans. The Traces page lists the traces your servers sent over OpenTelemetry, by their root span, and shows the one you select beside the list: its waterfall, the chosen span’s details, and the trace’s logs. To send traces, see Send telemetry.
Open Traces in the project’s menu, after Replays. You need view access to monitoring (Members and roles).
The list
Section titled “The list”The Traces page is a list and detail screen: the traces on the left, the selected trace on the right. The j and k keys select the next and previous trace, and Esc clears the selection. The selection is in the address, so you can share a link to it. On a narrow screen, a trace opens its own page. The full description is in Lists and details.
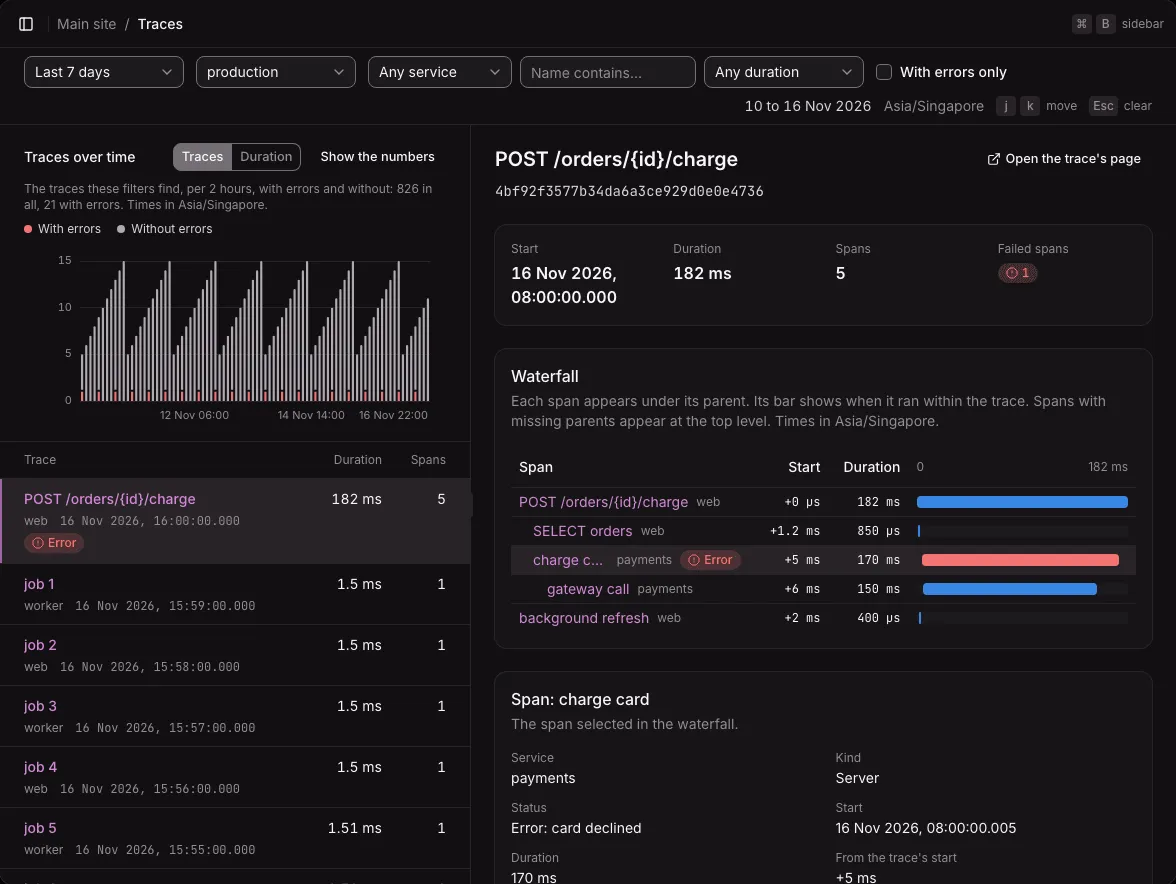
Each row is a root span, newest first:
- its name, with its service and when it started, to the millisecond, in the instance’s timezone;
- an Error badge when any span of the trace failed;
- its duration and the trace’s number of spans.
The list shows 100 traces at a time. Load older traces adds the next hundred.
With nothing selected, the right pane sums up the traces in the list: how many there are and how many have errors (“at least” while older traces are not loaded yet), the services of the period, and the five slowest traces in the list.
Traces over time
Section titled “Traces over time”Above the list, a chart shows the traces that the filters find over the period, as the list counts them: one for each root span. Each bar splits the traces with errors, at the bottom, from those without. Duration, beside the chart’s title, switches to a line of the 95th-percentile duration of each bar’s traces, and Traces switches back.
The bars work as on the Logs page: their length depends on the period (2 hours for 7 days, 6 hours for 30 days, a day for 90 days) and stays the same at every time of day, a click on a bar narrows the period to its day, and Show the numbers opens the data as a table. See Records over time.
A trace counts as with errors exactly as With errors only finds it. When the period holds more than 10,000 failed spans, the line under the title says that errors were counted among the latest 10,000.
Filters
Section titled “Filters”The filter bar holds the period and the environment, then four filters:
| Filter | What it keeps |
|---|---|
| Any service | The traces of one service. The list offers the services of the period and environment. |
| Name contains… | Root spans whose name contains the text, in any case. It applies when you press Enter or leave the field. |
| Any duration | Traces that took at least 10 ms, 100 ms, 500 ms, 1 s, or 5 s. |
| With errors only | Traces with at least one failed span. |
Each filter is in the address. A filter keeps the selected trace, and j then starts at the top of the new list.
A trace
Section titled “A trace”The selected trace shows its root span’s name and the trace ID, then its start, duration, number of spans, and failed spans. Open the trace’s page opens it on a page of its own, for a link or a narrow screen.
The waterfall
Section titled “The waterfall”The waterfall is a table of the trace’s spans, each under its parent, in the order they started:
- the span’s name, indented one step for each level, its service, and an Error badge when it failed;
- when it started, counted from the trace’s start (such as “+5 ms”);
- its duration, and a bar placed by its start and sized by its duration on the trace’s whole time.
A span whose parent never arrived stands at the top level. A trace can hold up to 2,000 spans on the page; past that, a note says how many it leaves out.
A span
Section titled “A span”Select a span’s name to see its details below the waterfall. The root span is shown first. The details are:
- its service, kind, status and status message, start, duration, span ID, its parent (by name, or “not received”), release, environment, and instrumentation scope;
- its attributes, its events (each with its time from the span’s start), its links to other traces, and its resource attributes, each as a table, with how many the sender dropped.
The trace’s logs
Section titled “The trace’s logs”Under the span, the trace’s log records follow, oldest first, up to 500. A record’s span is a button (“Show its span: …”) that selects that span in the waterfall. See Logs.
From an error
Section titled “From an error”A server error made from an exception carries its trace. The trace ID on the error’s page opens the trace’s page on the span where the exception happened. See Server errors.
Traces are kept for the instance’s telemetry retention, 30 days by default, and errors longer. So an error can name a trace that is no longer kept. The trace’s page then says so.
When nothing shows
Section titled “When nothing shows”- No traces yet: while the project has sent no spans at all, the page shows the OpenTelemetry settings to copy, with this instance’s address and
sk_…in place of the key, and a link to the project’s settings, where the secret key is. The page never shows the key. - No traces in this period: spans arrived, but none in the chosen period or environment.
- The page could not load: a busy instance answers that it cannot read now. The page says so and offers Retry. It does not retry by itself. A shorter period or a filter makes the read smaller.
Limits
Section titled “Limits”- A trace whose root span never arrived is not listed. A trace with two root spans is listed two times.
- The span count in the list counts the trace’s spans in the period, and an hour either side. The trace’s own page shows all of them.
- With errors only looks at the latest 10,000 failed spans of the period. With more failures than that, choose a shorter period to find older ones.
- Not available yet: zooming the waterfall into part of a trace, collapsing a span’s children, and filtering traces by an attribute.