The dashboard
The dashboard is the website of your instance, at its own address, such as https://analytics.example.com. Every screen in it is one of three kinds: a report, a list with details, or settings. This page explains each kind once. The pages for each feature link here.
The workspace and a project
Section titled “The workspace and a project”The dashboard has two levels.
- The workspace holds what belongs to the whole instance. Its menu, under the instance’s name, has Projects (the list of projects), Members and Settings for the owner and admins, and Design system, a reference of the dashboard’s parts.
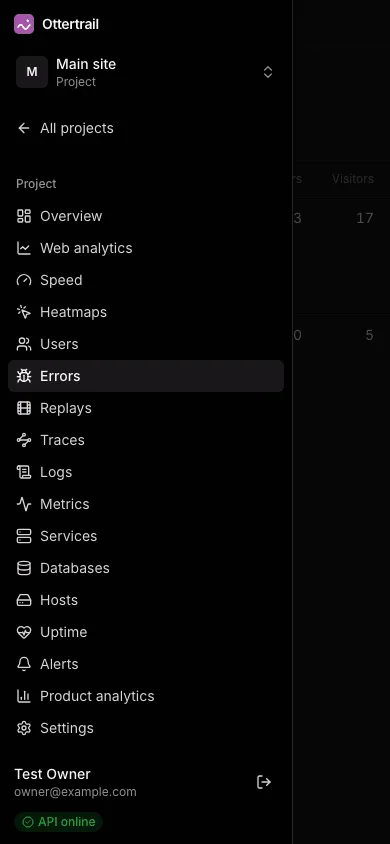
- A project holds one website or app. Inside a project, the sidebar shows the project’s own menu: Overview first, then the modules (Web analytics, Speed, Heatmaps, Users, Errors, Replays, Traces, Logs, Metrics, Services, Databases, Hosts, Uptime, Alerts, Product analytics), and the project’s Settings last. A member sees only the pages of the areas they were given. See Members and roles.
At the top of a project’s menu, the project switcher opens another project, and All projects returns to the workspace. The switcher keeps the page you are on: from one project’s web analytics for the last 90 days, it opens the other project’s web analytics for the last 90 days.
The header shows the project’s name and the page’s title. At the foot of the sidebar are your name, your email address, Sign out, and a badge that says whether the API answers.
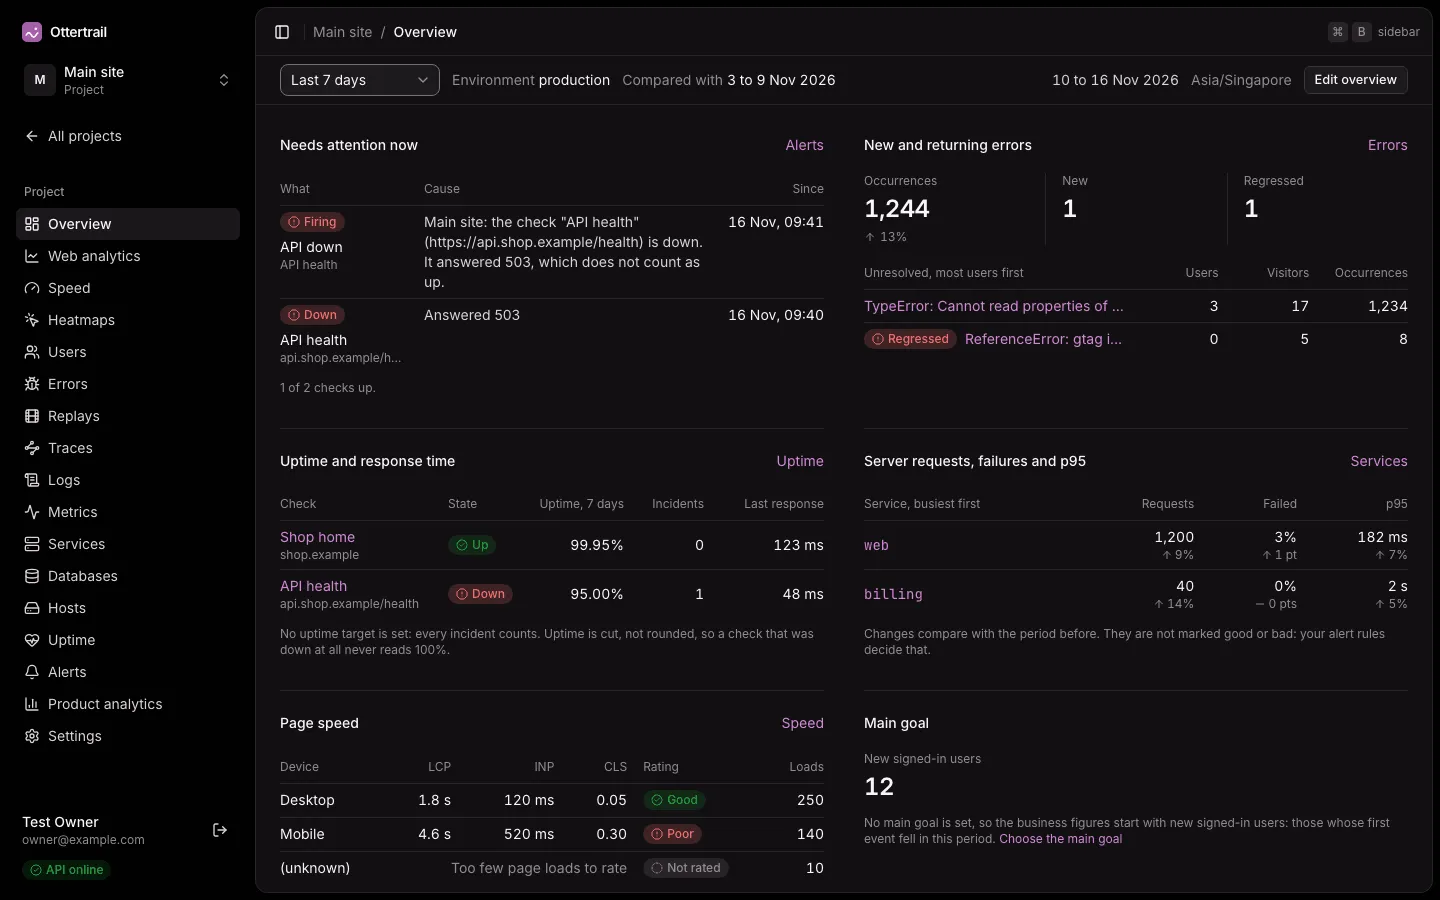
A project opens on its overview. A member without any of the overview’s areas lands on the first page they may open. The instance’s home page opens the project that this browser showed last.
Ctrl B (⌘ B on a Mac), or the button at the left of the header, collapses the sidebar to icons. The browser remembers the choice.
Reports
Section titled “Reports”Web analytics, Speed, Heatmaps, Product analytics, Services, Databases, Hosts, Metrics, and the Overview are reports. A report reads from top to bottom:
- The filter bar, pinned under the header. It holds the period, the environment (once another environment than production has events), the active filters, and, at the end, the days the report covers and the instance’s timezone. The days follow the instance’s timezone, not your browser’s.
- A row of figures. Under a figure, its change from the period before: an arrow and a size, such as “12%”. A change shows only when the counts behind it are large enough, because a few events make any percentage look large. A figure whose period before had nothing reads “New”. Colour does not mark a change as good or bad.
- Short charts, wide and low. Show the numbers opens the chart’s data as a table. Where a chart can show more than one measure, a row of buttons beside its title switches between them, and the chosen button is filled.
- Tables, side by side when the content area is wide enough, most first. Many lists show their first 10 rows, and Show all opens the full list with a search. In a table whose rows each open a page, such as the metrics, the hosts, a database’s query shapes, or a service’s routes, a click anywhere on a row opens it.
The period, the environment, and the filters are in the page’s address. A copied link opens the same view, and the Back button returns to the view before.
See Web analytics reports for the filters and the periods of the main report.
Lists and details
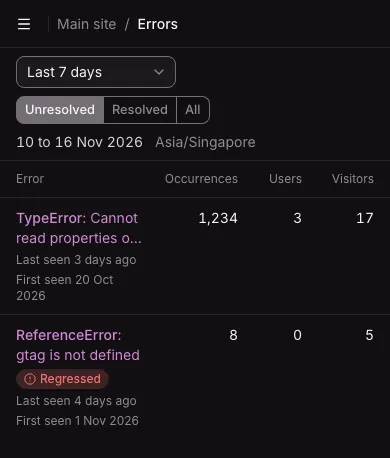
Section titled “Lists and details”Errors, Replays, Traces, Logs, Users, Uptime, and Alerts are lists with details. The list is on the left, and the selected item is on the right. You can drag the border between them.
- Nothing is selected when you arrive. The right pane shows a summary of the list: counts, what needs attention, or, when the list is empty, how to start.
- Click anywhere on a row to show the item on the right. The keyboard and screen readers use the item’s name, which is the row’s link or button.
- A button or switch inside a row, such as an alert rule’s switch or a check’s Pause, does only its own action.
- Ctrl-click (⌘-click on a Mac) or a middle click on a row opens the item’s own page in a new tab, and leaves the list as it was.
- The selected item is in the page’s address, so a reload keeps it, and a link opens it.
- Filters at the top narrow the list.
These keys work while the focus is not in a text field, an open list, a menu, or a dialog:
| Key | What it does |
|---|---|
j |
Selects the next item. With nothing selected, it selects the first. |
k |
Selects the previous item. |
Esc |
Clears the selection and shows the summary again. |
e |
On Errors only: resolves the selected error group, or reopens it. |
The filter bar lists the keys on wide screens.
Every item also has a page of its own, for a link to send to a teammate. Quick actions on a row, such as turning an alert rule off or pausing a check, apply at once. When you delete the selected item, the next item in the list is selected.
The save rule
Section titled “The save rule”Project settings, the instance’s Settings, and a member’s access are forms in sections. Each form has a Save bar at the foot of the screen, and every form follows the same rule:
- Save stays disabled until you change something in the section. It is disabled again when you undo the change.
- While there is a change, the bar says “Unsaved changes” and shows Discard. Discard puts back the saved values.
- A tab with unsaved changes shows an Unsaved badge. Moving between tabs keeps your edits.
- While the request runs, the bar says “Saving…”. A failed save shows the reason and keeps your edits.
- If someone else changes the same section while you edit it, the bar says so and offers Load the new values.
- Leaving the page with unsaved changes asks first: “Leave without saving?”, with Stay on this page and Leave and discard. Closing or reloading the browser tab gets the browser’s own question.
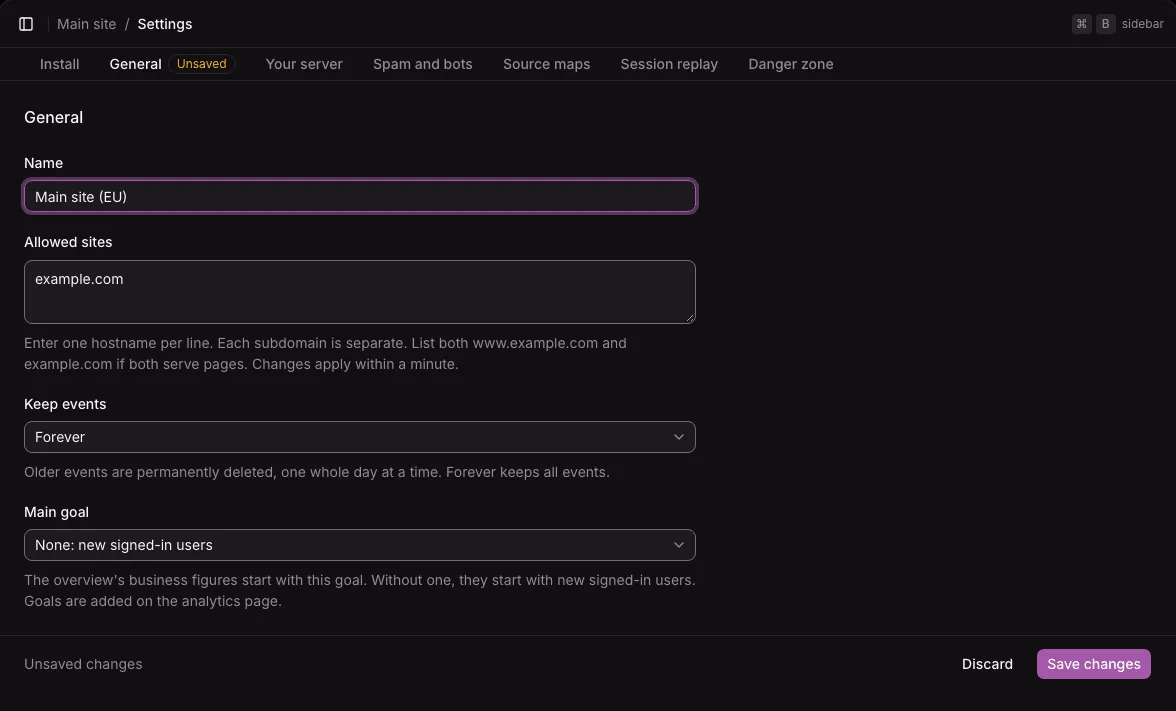
Actions that cannot be undone, such as deleting a project or replacing a key, are not part of a form. Each one asks for confirmation in a dialog first.
On a phone
Section titled “On a phone”The dashboard works at any width, from a phone to a wide screen.
- In a window under 60rem wide (960 pixels at the default font size), the sidebar is a menu behind the button at the left of the header. Choosing a page closes it.
- On a phone, the filter bar scrolls away with the page, the figures sit in two columns, and wide tables scroll inside themselves with the first column pinned.
- In a window under 64rem wide, a list fills the screen, and choosing an item opens the item’s own page. Back returns to the list. When the window grows wider again, the selected item shows beside the list as before.
- The row of settings tabs scrolls sideways.